Monitoring
Know within fifteen minutes when a site stops reporting
Each connected site sends a heartbeat every five minutes and a fuller runtime report every six hours. Manager tells you when a site goes quiet, when its TLS certificate is about to expire, how much disk it has left and whether its queue is healthy.
Fourteen days, no card. Craft CMS 4.4 and later.
A site that stops talking is not a site that is fine
A connector that stops checking in is its own signal. It might be a server that fell over, a deployment that removed the cron entry, or a site that was decommissioned and nobody told you.
The failure that costs the most is rarely dramatic. It is the disk that filled at 94 per cent three weeks ago and nobody looked, or the queue that stopped draining and took the search index with it.
What arrives, and how often
-
Heartbeat, every five minutes
It carries no data at all and needs no permission. Its only content is that it arrived.
-
Inventory, every hour
Craft version and edition, PHP version, database engine and version, every plugin and Composer package with its version.
-
Runtime, every six hours
Disk free and total, bytes and file count per asset volume, PHP limits, OPcache state, and render timings.
-
Failed sign-ins, every thirty minutes
Counts only, read from the columns Craft already keeps rather than by logging attempts.
-
From outside, twice a day
At 05:00 Manager opens a connection to the site's own hostname, completes the handshake, reads the certificate and closes. At 05:30 it makes one ordinary request and records what came back: security headers, whether plain HTTP redirects, what the response announces about the software. These are the checks a plugin running on the site cannot make correctly.
-
Availability is derived from what arrived
Over 24 hours, 7 days and 30 days. A gap counts as an outage once it exceeds three intervals, so fifteen minutes at the default cadence.
What it measures, stated plainly
Reporting is not visitor-facing uptime
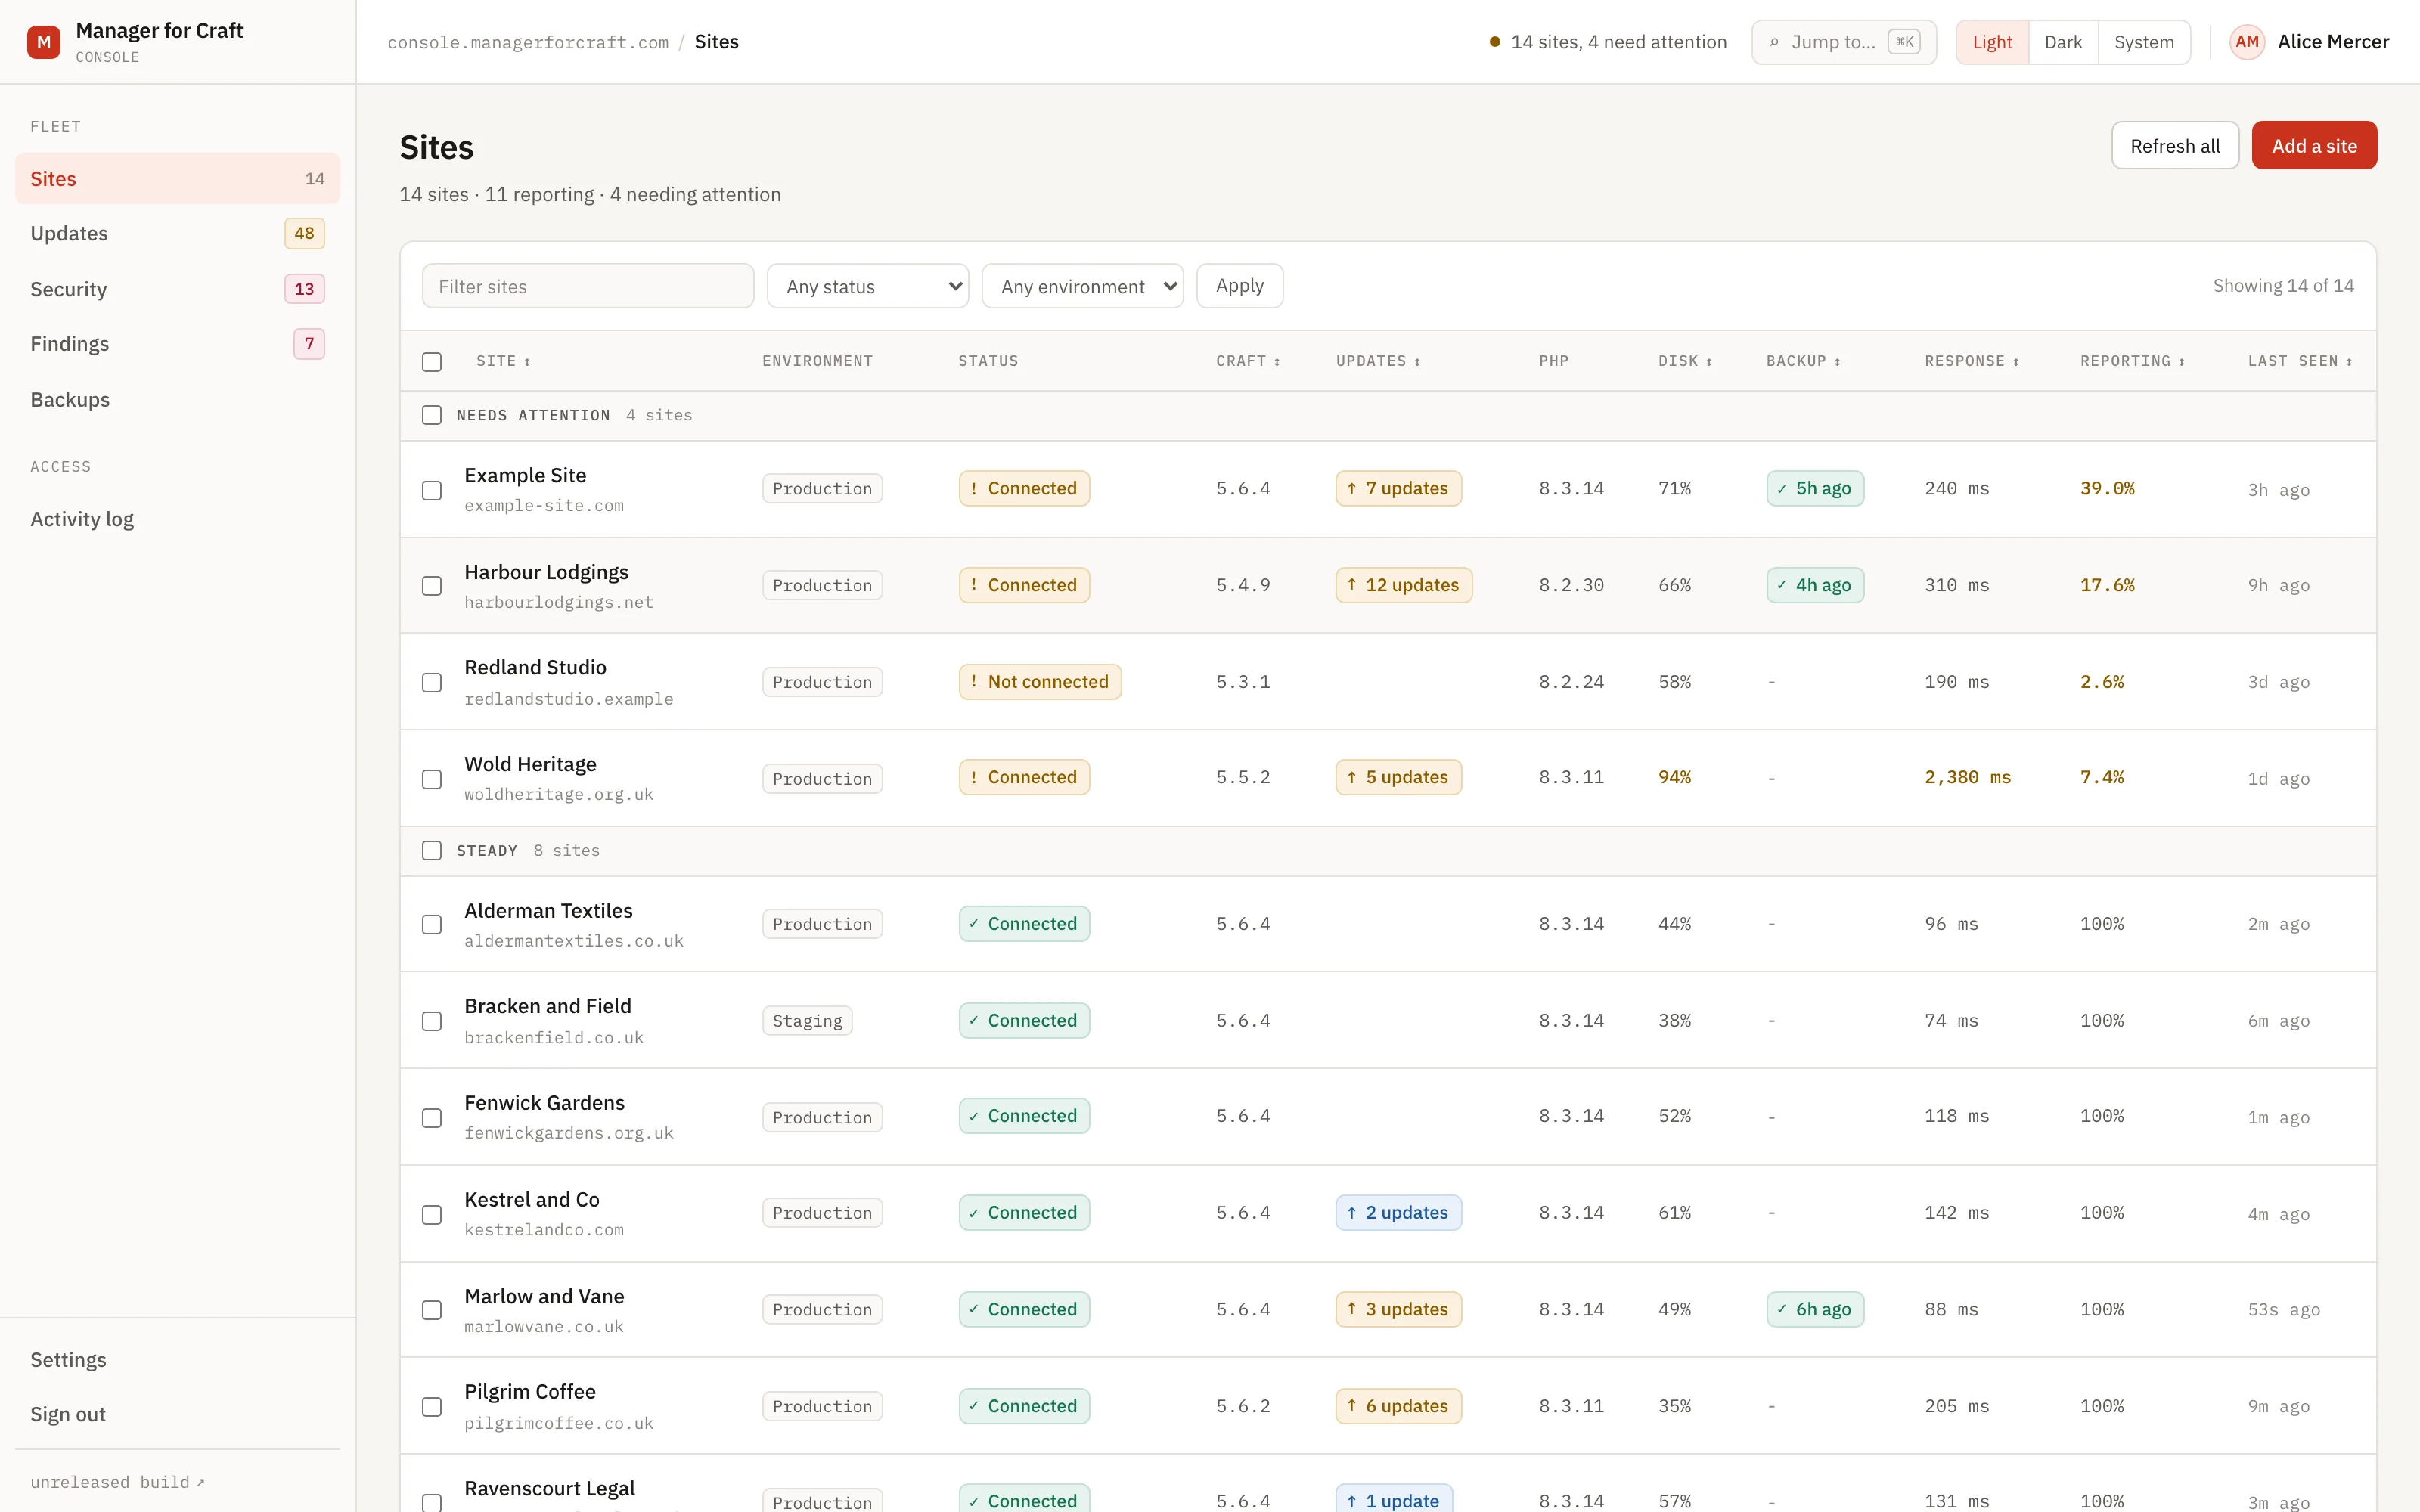
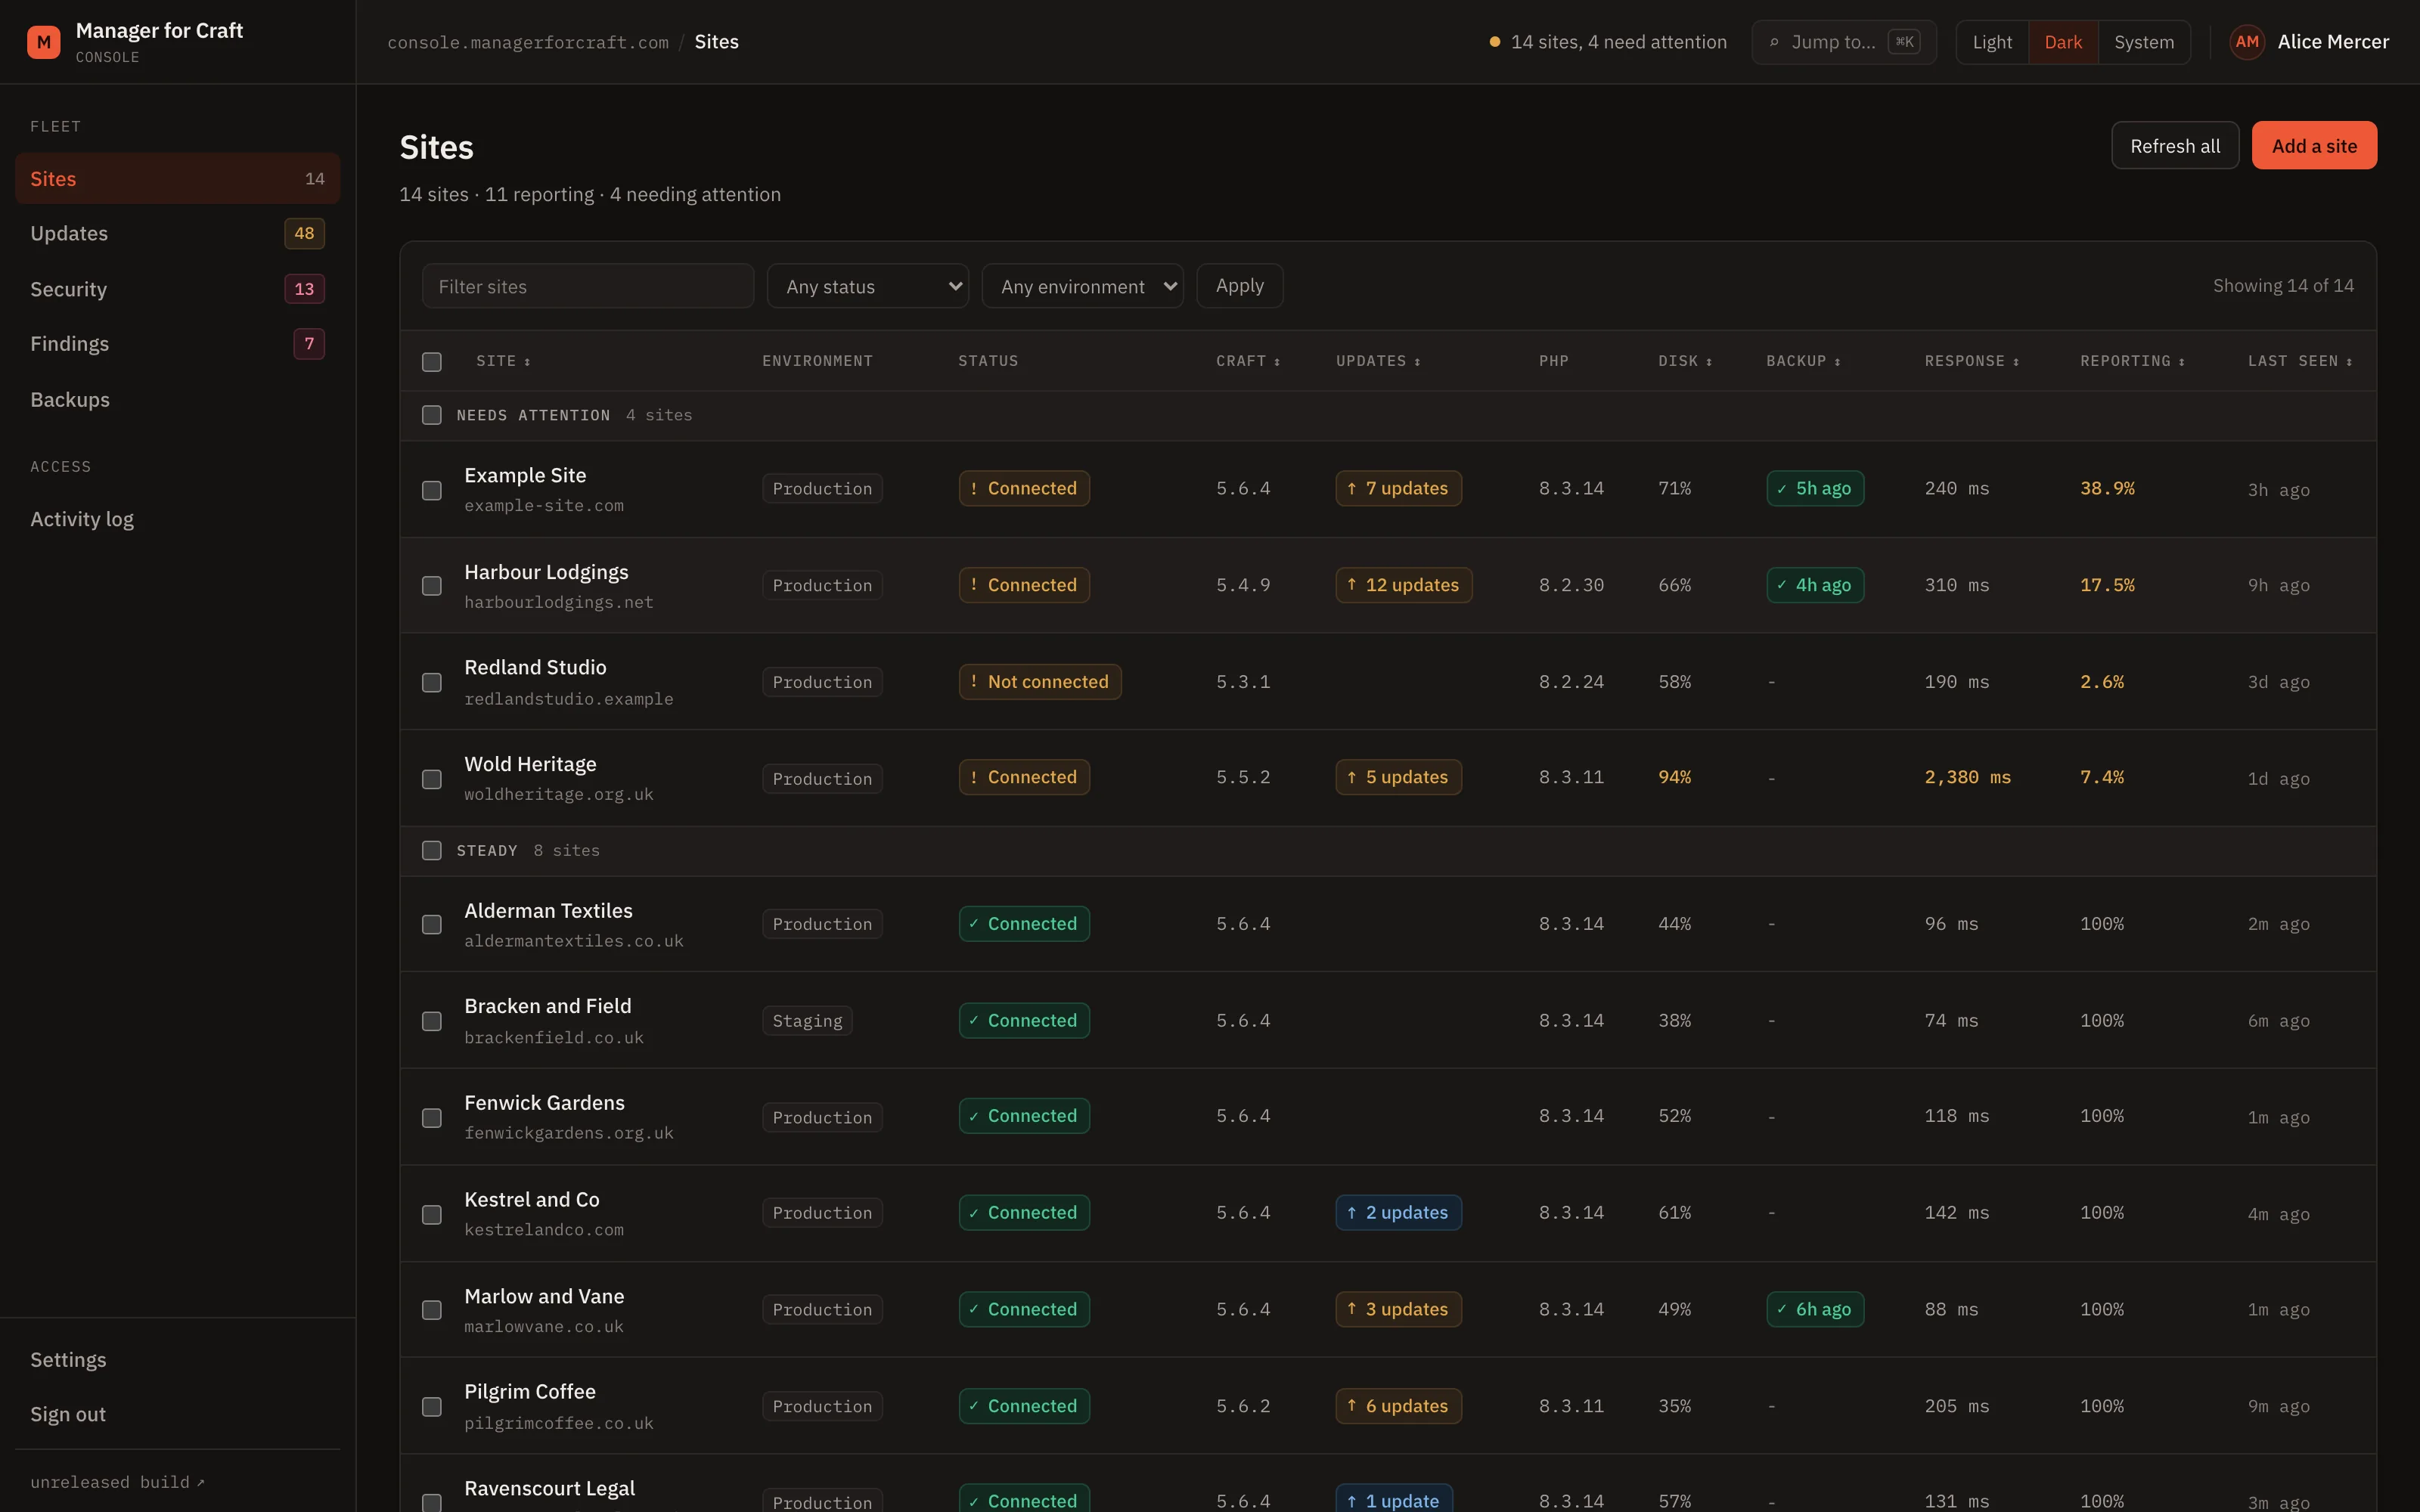
The figure on the sites list measures whether the site has been talking to us, not whether a visitor could load it. A site with a dead web server and a live cron entry keeps reporting, and the screen says so - which is why the column is headed Reporting rather than Uptime.
The outbound checks are bounded
Both go to the hostname an operator typed, never one that arrived in a payload. A domain resolving to a loopback, private or metadata address is refused by the same guard that protects webhook destinations, so neither can be turned into a request for cloud credentials. Manager can also knock on a site to ask it to check in early; nothing depends on that arriving, and MANAGER_NUDGE_ENABLED=false stops it.
A certificate that cannot be read is not a certificate problem
Usually it is DNS, a firewall, or a site that has moved. It shows on the site as unreachable rather than opening an expiry finding, because sending somebody to look at the wrong thing costs more than saying less.
Response times are server render time
Mean, median, 95th percentile and slowest, sampled from a ring of at most 200 requests on your own server. Not time to first byte, and not measured from a datacentre somewhere else.
Disk, per asset volume
Bytes and file count by volume handle, whether the volume is on that server or on remote storage, and free and total space on the disk. A volume that could not be measured says why: remote, out of time budget, or unreadable. Never a path, a filename or a directory listing, and never the bucket or the provider.
Queue and migration state
Queue depth, failed job count and whether migrations are pending. Counts only, never the contents of a queued job.
No cron, no problem
On hosting where you cannot add a cron entry, the connector drives its own schedule from ordinary web traffic. It reads nothing from the request and no URL reaches it.
Failed sign-in counts are a floor
Craft clears its counter on a successful sign-in, so the number you see is at least that many, not exactly that many. Every screen showing it says so.
The outcome
You find out that a site went quiet from Manager rather than from the client, that a disk is filling before it fills, and that a certificate did not renew a month before anyone sees a browser warning.
Read how it works
The documentation lives in the public repository, next to the code it describes, and every page carries a link to edit it.
Related
-
Monitoring your Craft sites for exposure
Sixteen rules for exposure alone. Findings open with a severity, and close themselves when the site is fixed.
-
Alerts for the issues that need a person
Five events, by email or webhook, filtered by severity. Queued, so a slow endpoint never delays a site report.
-
Craft and plugin updates across every site
See what is outstanding on every site, and which of it is a security release, without opening a single control panel.
See all your sites in about five minutes
Add a site, install the connector with Composer, paste the one-time code. The control panel updates within minutes. Fourteen days free, no card required, and nothing on your sites changes.
Craft CMS 4.4 and later